
| Introduction to the topic and the process in the previous post. | Einleitung in das Warum und Wie im letzten Beitrag. |
| In the next image it indeed looks like that it rains less at home (the white dot in the centre; the box is 21 x 21 pixel or 7 x 7 km) than in the area around it. For each month the central area received less rain than the surroundings. | Im nächsten Bild sieht tatsächlich so aus, als ob es zu Hause (der weiße Punkt im Zentrum; die Box ist 21 x 21 pixel, 14 x 14 km) weniger regnet. Für jeden der abgedeckten Monate gibt es in der Bildmitte einen trockeneren Bereich. |
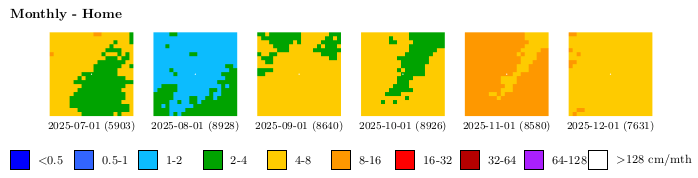
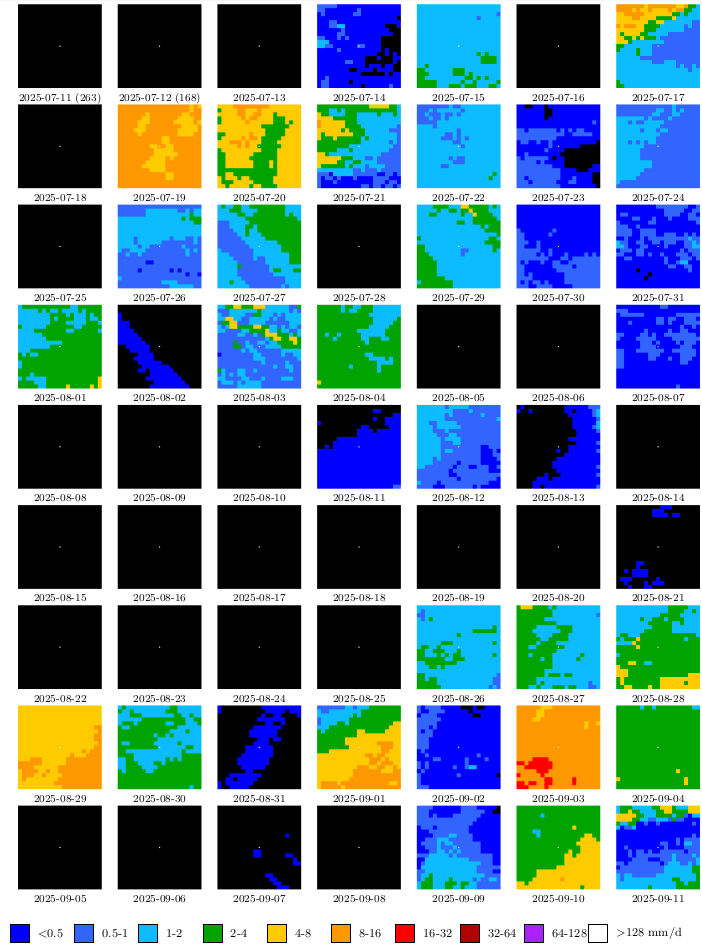
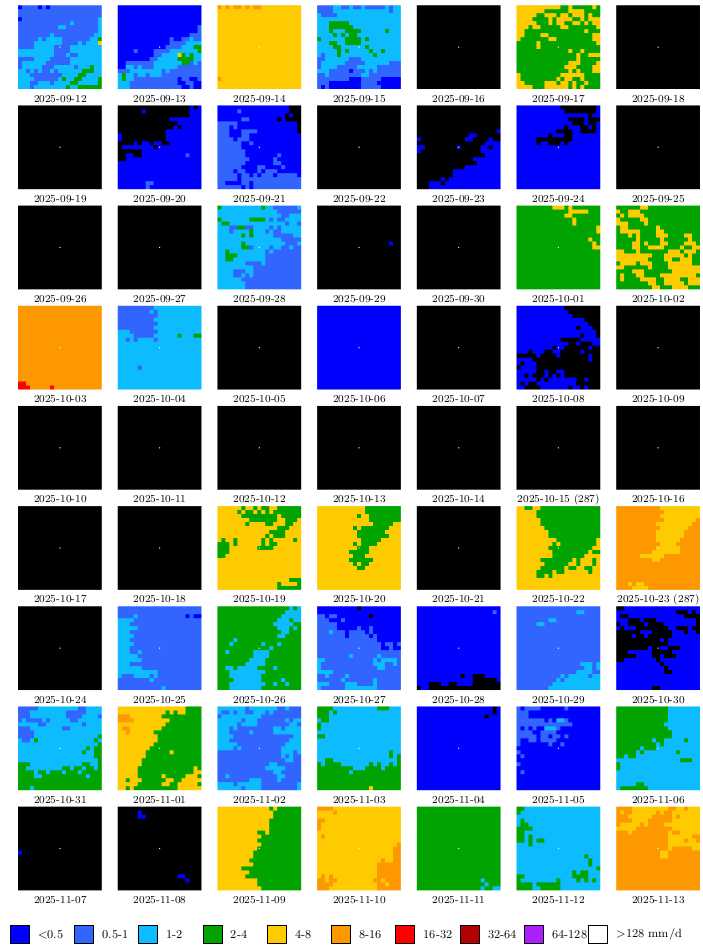
| That pattern is visible in the weekly summarised data for some weeks, but not in the 18 weeks of daily data below (except for 3 days mid October). | Dieses Muster ist in den wochenweise zusammengefassten Daten in manchen sichtbar, jedoch nicht in 18 Wochen von täglichen Zusammenfassungen (mit Ausnahme von 3 Tagen Mitte Oktober). |
| So it seemed that indeed it rains less at home than a bit further away. But the similar pattern of this line from southwest to northeast made me doubt it. The prevailing wind is that direction, but there is no feature in geography that would explain it. | Es wirkt tatsächlich so, als ob es Zuhause weniger regnet als ein paar Kilometer weiter östlich oder westlich. Aber das ähnliche Muster von Südwesten nach Nordosten machte mich unsicher. Die dominante Windrichtung ist zwar in diese Richtung, allerdings gibt es um den Start herum keine markante Änderung in Geografie, die das Muster erklären würde. |
| So I added another region: 100 × 100 km around home. The next image shows the monthly summaries. And there “rays” coming from the radar station in the lower-left corner become visible. The calibration between radar echo strength and rainfall seems to be incorrect in some directions and assume too little attenuation. One of these “rays” just happens to pass right over the garden. | Also habe ich nochmal eine weitere Region dargestellt: 100 x 100 km ums Zuhause. Im nächsten Bild sind die monatlichen Zusammenfassungen. Und da sieht man “Strahlen” von der Radarstation in der unteren linken Ecke kommen. Die Kalibrierung zwischen Stärke des Radarechos und Regen scheint in ein paar Richtungen nicht korrekt zu sein und zu wenig Dämpfung anzunehmen. Einer dieser “Strahlen” geht zufällig über den Garten. |
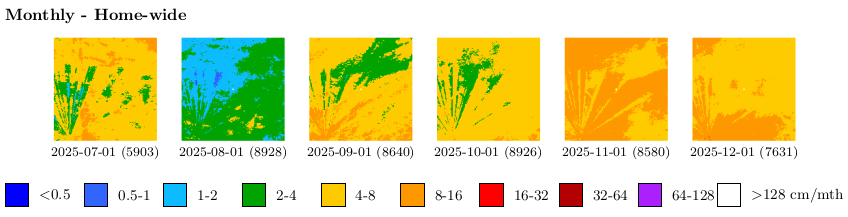
| So it seems the garden gets as much water as the surrounding area. It will be interesting how late spring and early summer look next year, as I only started gathering data by mid July 2025. | Der Garten scheint also genauso viel Regen wie die Umgebung abzubekommen. Mal sehen wie der späte Frühling und Sommer nächstes Jahr aussehen, da meine Datensammlung erst Mitte Juli 2025 anfängt. |
| On some days you can indeed see that the rain passed by: July 17, 20, 21, 27, and 29, as well as August 3 and September 11 and 13; however, there are also days that show the opposite. | An einigen Tagen sieht man tatsächlich, dass der Regen vorbei gezogen ist: 17., 20., 21., 27. und 29. Juli, sowie 3.8., 11. und 13.9., allerdings gibt es auch entgegengesetzte Tage. |
